Every affiliate knows the feeling: you open Ads Manager and see dozens of numbers — CPM, CTR, ROAS, conversions. The data is there, but what to do with it is another story. Budgets get drained, decisions are made emotionally, and bundles die before you even have time to evaluate their potential.
This article is about reading Facebook Ads statistics without panic or guesswork. We’ll break down key metrics, show when to cut a campaign and when to scale it, and organize the chaos of numbers into a clear system.
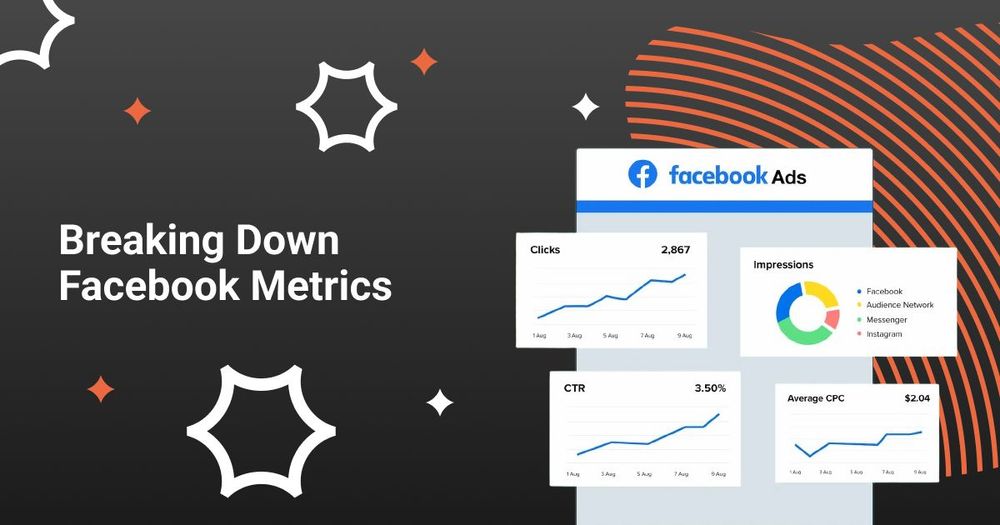
Key Metrics in Facebook Ads
There are tons of numbers in Ads Manager, but only a few really matter for decision-making. Out of the abundance of graphs and figures, focus on five core metrics. They reflect creative effectiveness, budget spend, audience quality, and final profit.
CPM: What You’re Paying Facebook For
CPM is the cost per thousand impressions. Simply put, you’re paying not for clicks or conversions, but for the mere fact your ad was shown. That’s why CPM is the first signal of how expensive your audience is.
What affects CPM:
- Attention competition: More advertisers vying for your audience = higher CPM;
- Ad format: Video and interactive formats are usually more expensive than static images;
- Time and placement: Prime-time evening slots or main feed placements cost more than off-peak slots;
- Targeting quality: The more precise and valuable the audience, the higher the CPM.
A high CPM isn’t always bad — if the bundle is profitable and ROAS is positive, paying more per thousand views is fine. But if CPM grows while traffic quality stagnates, that’s a red flag: check your settings and creatives.
CTR: The Litmus Test for Interest
CTR (Click-Through Rate) shows what percentage of users clicked on your ad. It tells you how well the creative and offer resonate with the audience.
What influences CTR:
- Creative appeal: Bright images or videos beat dull banners;
- Offer strength: A sharp painkiller offer gets more clicks;
- Audience relevance: Even the best creative fails with the wrong audience;
- Creative fatigue: CTR drops as audiences get bored.
High CTR is great, but not a profit guarantee. You can get tons of clicks and zero conversions if your offer or landing page isn’t strong. Conversely, low CTR is a clear signal to rework creatives or segmentation.
CPC: What Your Clicks Cost — and Why It’s Not Everything
CPC (Cost per Click) is the cost of one click on your ad. Logically, it ties to both CPM and CTR: expensive impressions and few clicks lead to higher CPC.
What affects CPC:
- Auction competition: More advertisers = pricier clicks;
- Creative quality: Clickable creatives reduce CPC even with expensive impressions;
- Audience segments: Narrow/high-value segments cost more; mass audiences yield cheaper clicks.
Low CPC doesn’t mean a profitable bundle. Cheap clicks are pointless if they don’t convert. Use CPC as a supporting indicator — it helps evaluate creatives and targeting but never analyze in isolation.
CR: The Metric That Decides the Fate of Your Bundle
CR (Conversion Rate) shows the % of users who took action after clicking (purchase, sign-up, etc.). For affiliates, CR matters more than clicks — it answers whether your traffic earns money.
What affects CR:
- Traffic quality: Broad audiences convert worse than focused segments;
- Landing page & offer: Slow loading or weak offers tank CR;
- Mobile optimization: Most users come from phones — if your site isn’t mobile-friendly, CR crashes;
- Trust: Suspicious designs or unknown brands repel users.
Even with cheap clicks, a bundle can be unprofitable if there are no conversions. Moderate CPC and high CR? That’s a scale-worthy combo.
ROAS: The Ultimate KPI
ROAS (Return on Ad Spend) measures whether your ad budget paid off. If you spent $100 and earned $300 — ROAS = 3. This is your ultimate decision-maker: scale or shut it down.
What affects ROAS:
- Traffic costs: High CPM/CPC eat into profit;
- Conversions: Expensive clicks can pay off if CR is strong;
- Average order value & upsells: The more you earn per sale, the better your ROAS;
- Campaign stability: Algorithms need time to learn — ROAS may start low and grow.
ROAS < 1 = losses. But always look at trends — some campaigns hit positive ROAS after tuning or higher order values.
Important: don’t confuse ROAS with ROI. ROI includes all costs (ads, team, services), while ROAS tracks only traffic spend. There’s also ROMI — broader marketing effectiveness.
Interpreting Metrics in Context
You now understand CPM, CTR, CPC, CR, and ROAS. But isolated numbers mean nothing — the synergy matters. A high CTR with no profit? A misleading win. High CPM? Not an issue if paired with great ROAS.
Here’s how to use metrics as a system to decide:
When to Kill a Campaign
Pulling the plug is painful, but it saves money. Cut the campaign if:
- CTR keeps falling, and new creatives don’t help;
- CPM rises with no quality traffic gain;
- CPC exceeds limits, and conversions don’t cover it;
- CR stays low even after fixing lander/offers;
- ROAS is under 1 after the learning phase.
Killing a campaign isn’t failure — it’s part of the game. The sooner you stop what’s not working, the more budget you save for tests.
When to Scale a Campaign
If the numbers look good — double down. Scale if:
- ROAS is consistently above target;
- Conversions come at stable cost;
- CTR stays strong = audience still responds;
- CR confirms traffic quality;
- Learning phase is done = metrics are stable.
Scaling isn’t just budget doubling. Sometimes it's better to duplicate the bundle, test new audiences or creatives.
Don’t overdo it: rapid growth can confuse algorithms and tank results.
Common Mistakes Reading Stats
Top mistake: focusing on one metric. Example: CTR is high, but no conversions? Your creative draws the wrong crowd. Or CPM seems high, but if CR and ROAS are strong — who cares?
Another trap: comparing Ads Manager data directly with affiliate stats. Facebook uses different attribution models — expect delays and mismatches. If you judge based on that, you may kill a working campaign prematurely.
Also: rushing decisions too early. Give the algorithm time — 1K impressions and a few dozen clicks is the bare minimum for semi-reliable data.
What Skews Facebook Ads Stats
Sometimes stats lie — or mislead. Here’s what to watch for:
- Learning phase: Early days are volatile. Algo is testing segments and placements;
- High frequency: Small audiences + big budgets = repeated views, CTR drops due to fatigue;
- Seasonality: Black Friday, New Year — CPM spikes due to competition, not offer failure.
These don’t mean your creative or bundle is weak. They just distort the picture. Your job: separate real problems from noise.
Final Thoughts
Facebook stats aren’t chaos — they’re a marketing compass. Don’t read them in isolation. CPM = audience cost, CTR/CPC = creative effectiveness, CR = traffic quality, ROAS = payoff.
Campaigns take time. Algorithms learn, users react, creatives fade.
Your job isn’t to panic at the first numbers — it’s to find patterns. That’s how you stop gambling and start scaling with confidence.
Learn to read metrics as a system — and stats will stop driving you crazy and start growing your business.
P.S. If you're working with Facebook Ads through RentAcc, stats become easier to manage — high-trust accounts, instant replacements, and real people to help when the numbers don’t add up.
Facebook accounts rentacc.agency